How Traders Use Equity Curves to Control Risk
Traders use equity curves to control risk by treating their own performance data as a tradable asset, applying moving averages or trendlines to their account growth to dictate when to scale up or sit out. Instead of just focusing on the next trade’s setup, professionals monitor the slope of their equity. If the curve falls below a specific threshold, like a 10-trade simple moving average, they reduce position sizes or pause trading entirely until their strategy regains its edge. This meta-strategy ensures that you only risk significant capital when you are “in sync” with the market’s current regime.
The Equity Curve as a Diagnostic Tool
Most retail traders look at their account balance once a day and feel either “good” or “bad” based on the number. In 2026, consistent traders view their equity curve as a living map of their psychological and strategic health.
A smooth, upward-sloping curve indicates a strategy that is well-aligned with current volatility. Conversely, a jagged curve with deep “cliffs” is a red flag for revenge trading or oversized positions. By plotting every trade on a graph, you can see if your losses are clustering, a signal that the market regime has changed (e.g., from trending to range-bound) and your strategy is no longer effective.
Trading the “Moving Average” of Your Performance
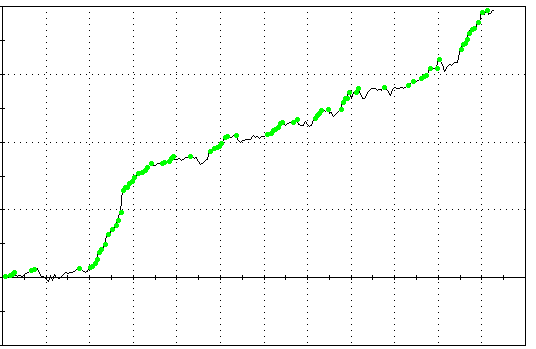
One of the most powerful risk-control techniques used by professionals today is equity curve trading. This involves applying a technical indicator, usually a 10 or 20-period simple moving average (SMA), directly onto your equity curve graph.
- The Green Zone: When your actual equity is above its moving average, your strategy is “hot.” This is the time to trade your full size or even consider slightly scaling into winners.
- The Red Zone: When your equity crosses below the moving average, you have entered a performance drawdown.
In the Red Zone, consistent traders switch to ghost trading or nano-sizing. They continue to record their signals but don’t risk real capital (or risk only 0.1%). They only resume full-size trading once the “ghost” equity curve crosses back above its moving average, proving the strategy has found its rhythm again.
Dynamic Position Sizing Based on Curve Volatility
In 2026, fixed fractional risk (e.g., always risking 1%) is often considered too rigid. Advanced traders use equity curve feedback to adjust their risk units.
If your equity curve is currently in a 3% pullback, your next trade’s risk might be reduced to 0.5%. If the pullback deepens to 5%, the risk drops to 0.25%. This “graduated defense” makes it mathematically difficult to hit a prop firm’s maximum drawdown limit because your risk shrinks as you approach the “danger zone,” effectively extending your “trading life” during a bad streak.
Conclusion – How Traders Use Equity Curves to Control Risk
An equity curve is more than a record of the past; it is an early warning system for the future. By applying technical analysis to your own performance, you remove the ego from the decision-making process. In 2026, the elite traders are those who know that flat is a valid position. When your equity curve tells you that your edge is dull, the most profitable move you can make is to protect what you’ve already earned.
FAQ – How Traders Use Equity Curves to Control Risk
1. Isn’t ghost trading just a waste of time?
Actually, it’s a critical psychological and statistical safeguard. Ghost trading allows you to stay sharp and collect data without the emotional pain of a real-world drawdown. It proves whether your strategy is “broken” or just temporarily out of favor with the current market cycle.
2. What is the best moving average length for an equity curve?
For most intraday traders, a 10 to 20-trade SMA is the sweet spot. A shorter average (5-period) reacts too quickly to a single loss, while a longer one (50-period) might not warn you until you’ve already lost a significant portion of your account.
3. Can I use this for prop firm evaluations?
Absolutely. In fact, it’s one of the best ways to pass. Since prop firms have strict daily and total drawdown limits, using an equity curve moving average can prevent you from hitting those “hard caps” by forcing you to slow down the moment your performance starts to dip.
We have helped thousands of traders reach funding at TTT Markets from account sizes of $5k upwards to $500k. Check out our programs.
Additional resources:
How Top Traders Use the Equity Curve to Build Wealth and Avoid Blowups | TraderLion
Understanding Equity Curves: Definition, Analysis, and Calculation Guide

 support@tttmarkets.com
  WhatsApp Support →


